Algorithmic Simplicity's Hidden Costs and Pandas 3.0 Performance Gains
This conversation unpacks the often-overlooked performance implications of software development, particularly how algorithmic choices and library updates impact scalability and maintainability over time. It reveals that immediate gains in development speed or code elegance can mask significant downstream costs, leading to systems that degrade unexpectedly under load. This analysis is crucial for developers, team leads, and architects who need to build robust, scalable applications and avoid the common pitfalls that lead to performance bottlenecks and costly refactors. By understanding the interplay between code design, testing methodologies, and evolving tools like pandas, readers can gain a strategic advantage in building software that endures and performs, rather than merely functions.
The Hidden Cost of Algorithmic Simplicity
The pursuit of elegant code and rapid development often leads teams to overlook the fundamental scalability of their chosen algorithms. While a solution might appear clean and efficient for small datasets, its underlying Big O complexity can become a ticking time bomb as data volumes grow. Itamar Turner-Trauring's article, "Unit Testing Your Code's Performance," highlights this by advocating for tests that specifically check for degraded Big O bounds. This isn't about micro-optimizations; it's about preventing catastrophic performance collapse.
Consider a common scenario: a team implements a feature using nested loops, which, while straightforward to write, results in O(n^2) complexity. For a few dozen records, this is imperceptible. But as that dataset scales into thousands or millions, the processing time explodes, rendering the application unusable. The immediate benefit of a simple implementation is dwarfed by the long-term cost of an unscalable algorithm. The danger is that such issues often go unnoticed until they manifest in production, often during peak load or after a significant data ingestion event.
"The advantage of this approach is that it catches the kinds of errors that can be really problematic at scale without being finicky about the variability of performance test data that can change locally because of your cache or other things running on your machine or the phase of the moon or whatever else causes that kind of stuff."
This reveals a critical insight: conventional unit tests, focused on functional correctness, fail to capture performance regressions. The "Big O scaling" approach, however, acts as a proactive defense, ensuring that the algorithmic foundation remains sound. This requires a shift in testing philosophy, moving beyond mere correctness to embrace performance characteristics as first-class citizens. The payoff for this proactive stance is significant: avoiding costly rewrites and maintaining user trust by ensuring consistent performance, even as the system is stressed.
Pandas 3.0: Embracing Predictability and Performance
The release of pandas 3.0 introduces several changes that address long-standing pain points, particularly around data manipulation and string handling. Christopher Trudeau’s discussion of the new features, including pd.col for cleaner column operations, copy-on-write (COW) for predictable data frame behavior, and a dedicated string data type, points to a broader trend: prioritizing clarity and performance over historical quirks.
The old way of modifying data frames, using square bracket notation for both existing and new columns, often led to subtle bugs. The introduction of pd.col and method chaining offers a more explicit and robust way to perform column-wise operations. This is crucial because it eliminates the ambiguity of in-place modifications versus returning new data frames, a common source of the dreaded "setting with copy" warning. The shift to COW, where filtering operations now consistently return copies, removes a significant class of errors that previously required developers to meticulously manage data frame copies.
"The article showcases the new dedicated string D type, a cleaner way to perform column-based operations, and a more predictable default copying behavior with copy-on-write."
Furthermore, the new dedicated string data type, backed by PyArrow, represents a substantial performance leap. Storing strings as generic Python objects in older pandas versions was a notorious bottleneck, leading to slow operations and increased memory usage. By leveraging contiguous memory blocks and a compact binary format, the new string type promises five to ten times faster string operations and up to 50% memory reduction. This is not just an incremental improvement; it’s a fundamental architectural shift that directly addresses scalability concerns for data-intensive applications. The interoperability with the Arrow ecosystem further amplifies this benefit, allowing data to be passed between libraries without costly conversions, a key enabler for efficient data pipelines.
The Unseen Complexity of Frameworks and Profiling
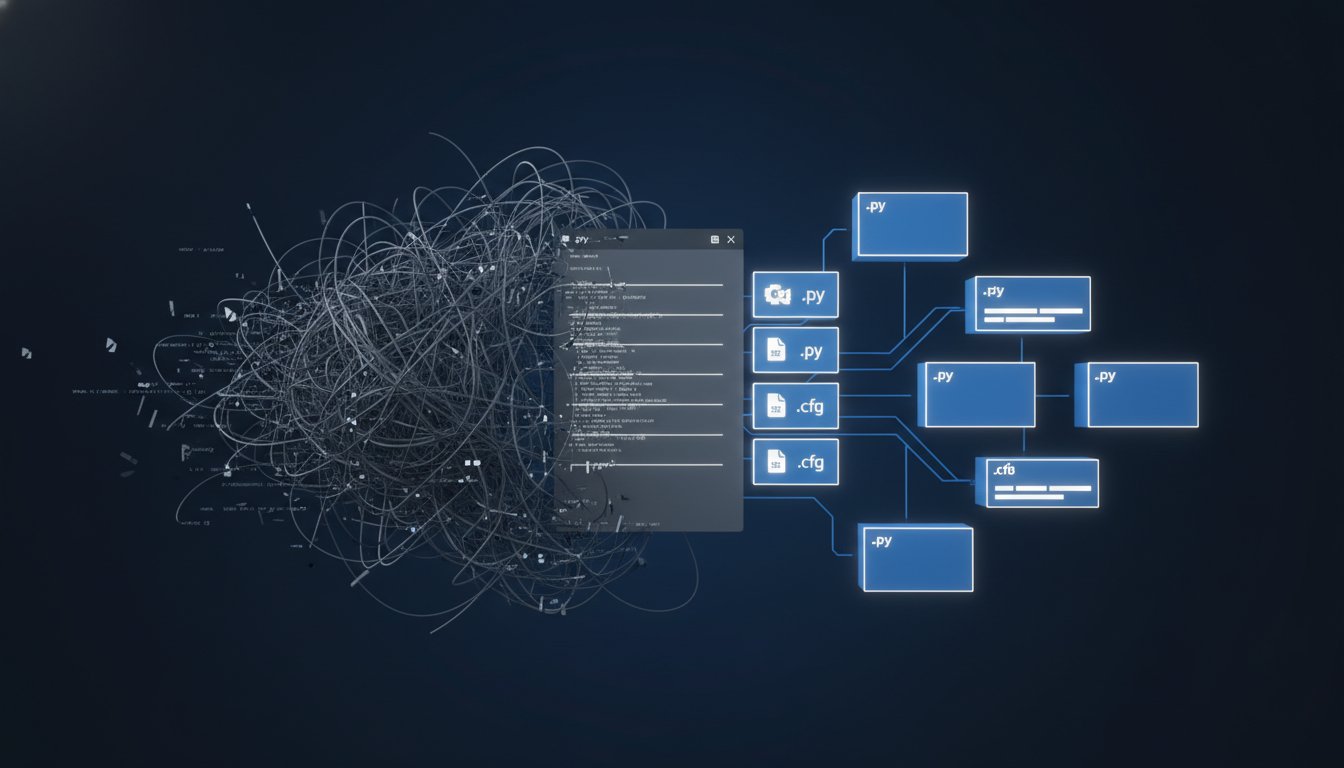
Adam Johnson's "Introducing T-Prof" tackles another subtle but pervasive challenge in software development: the difficulty of profiling code within larger frameworks. Profilers typically measure the performance of an entire program, which can be unwieldy when trying to isolate the performance of a specific function buried within layers of framework logic. T-Prof, a targeted profiler, addresses this by allowing developers to focus precisely on the performance of individual functions.
This is particularly relevant for developers working with frameworks like Django. As Trudeau notes, "anytime you're dealing with a framework, you're not calling the code yourself, something else is calling your code." When a web request hits a Django application, a cascade of framework code executes before reaching the developer's view function. If that view function is slow, a traditional profiler might attribute the time spent to the framework's internal mechanisms rather than the developer's specific logic. T-Prof cuts through this noise, enabling developers to pinpoint the exact functions they control and optimize.
"The tool's ready to go. You can play with it and install it from PyPI."
The advantage here lies in efficiently allocating optimization efforts. Instead of spending hours sifting through profiler output for a monolithic application, developers can use T-Prof to get concise, actionable data on specific functions. This targeted approach accelerates the feedback loop for performance improvements, especially when comparing "before" and "after" states of a refactored function. The underlying technology, sys.monitoring in Python 3.12, signifies a move towards more granular and accessible performance introspection, empowering developers to build more performant applications by focusing their efforts where they matter most.
Actionable Takeaways
- Implement Big O Performance Tests: Integrate tests that assert algorithmic bounds into your CI/CD pipeline. This is an immediate action to prevent future scalability issues.
- Adopt Pandas 3.0 Features: Migrate to pandas 3.0 to leverage the performance gains from the dedicated string type and the predictability of copy-on-write. Prioritize this for new projects or during refactoring cycles.
- Utilize Targeted Profilers: Employ tools like T-Prof when optimizing code within frameworks to isolate performance bottlenecks to specific functions. This is an immediate action for debugging performance issues.
- Embrace Predictable Data Handling: Actively use
pd.coland understand the copy-on-write behavior in pandas 3.0 to avoid "setting with copy" errors. This should be a standard practice for any new data manipulation tasks. - Invest in Algorithmic Understanding: Dedicate time for engineers to study and understand the Big O complexity of common algorithms. This is a foundational, long-term investment in building scalable software.
- Focus Profiling Efforts: When performance issues arise, use targeted profilers to quickly identify the most impactful areas for optimization, rather than broad, time-consuming system-wide profiling. This is an immediate action when performance problems are detected.
- Consider Framework Overhead: When optimizing code within frameworks, be aware of the framework's own performance characteristics and use specialized tools to isolate your code's contribution. This is a strategic consideration for any framework-based development.


